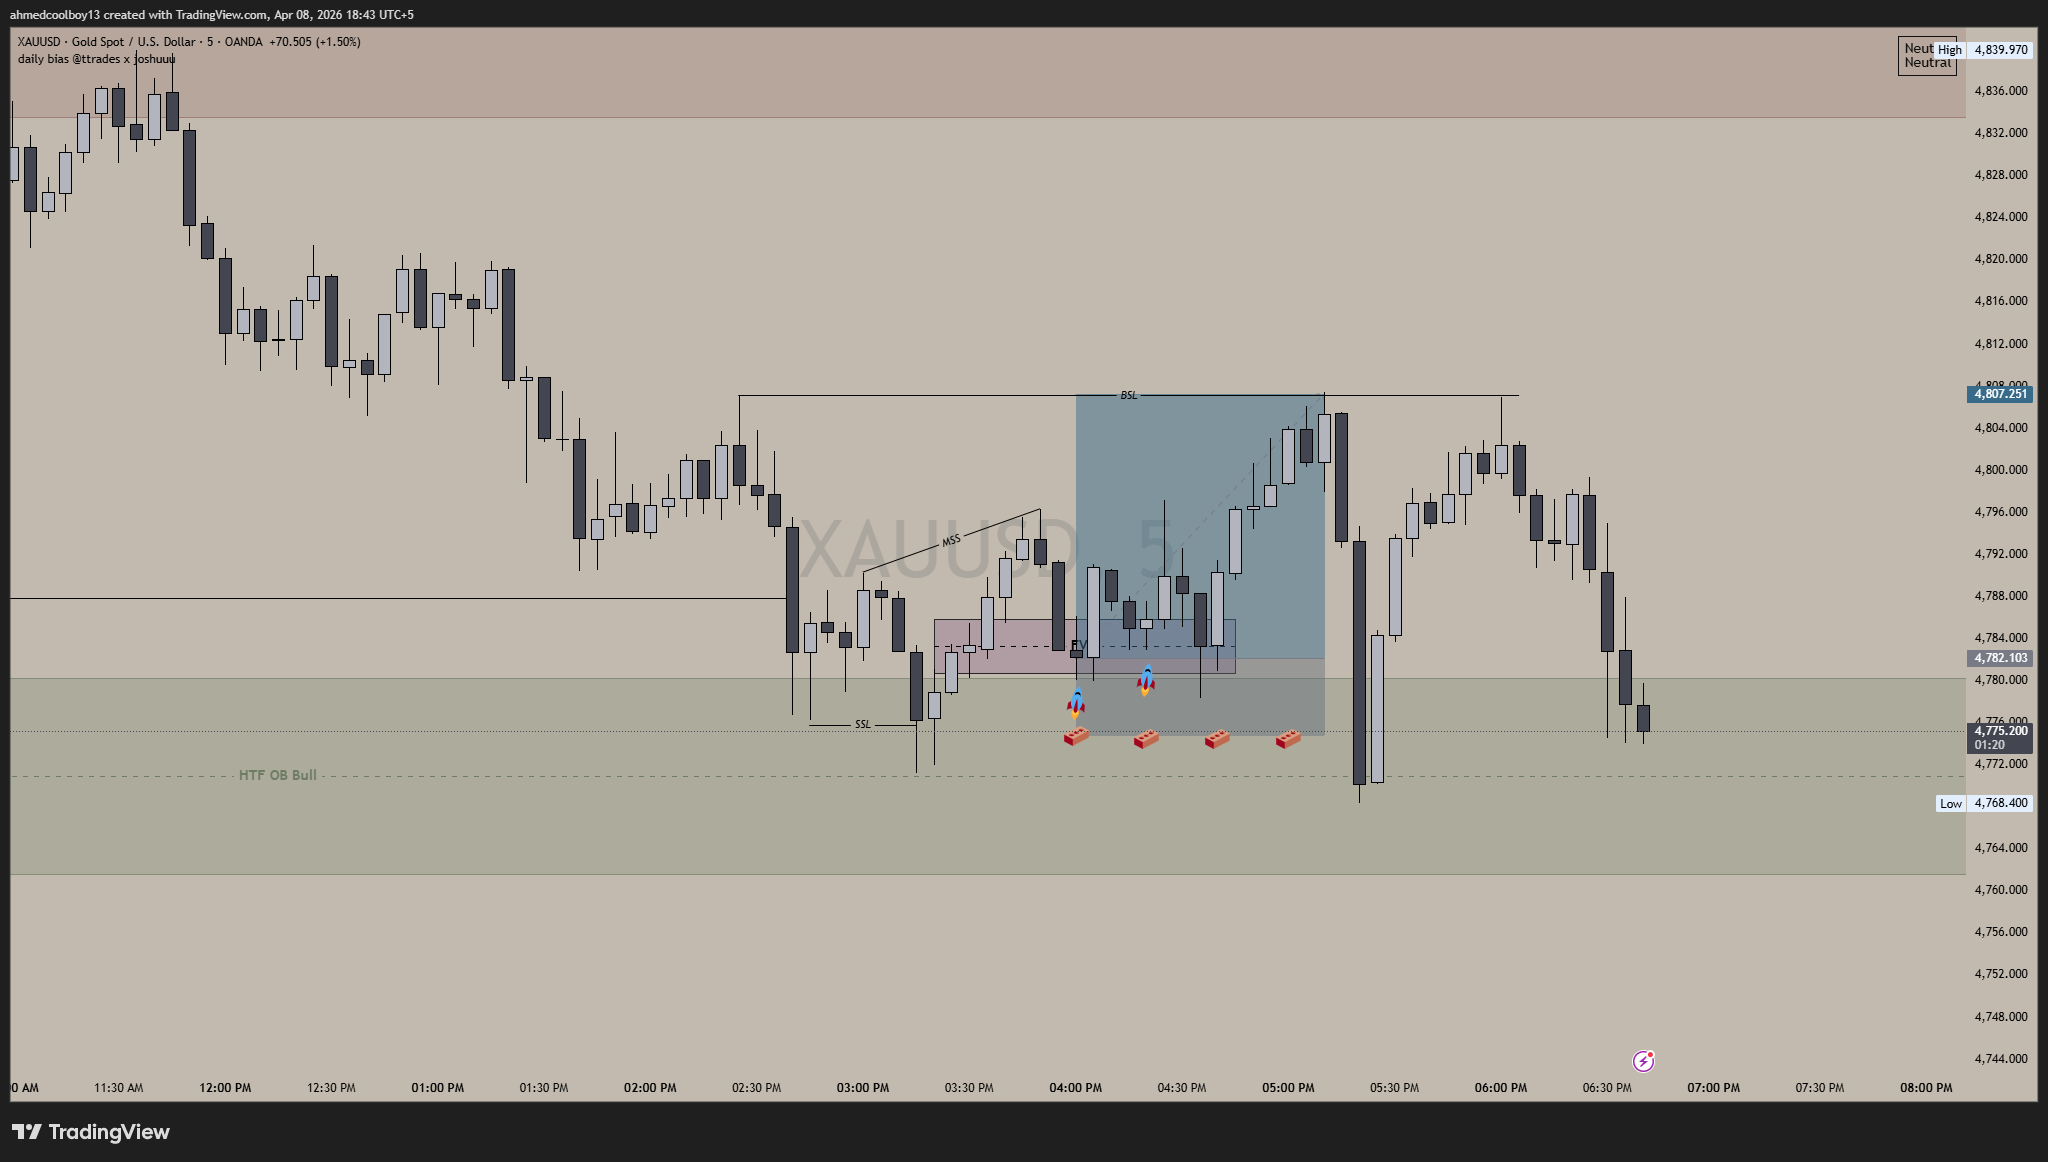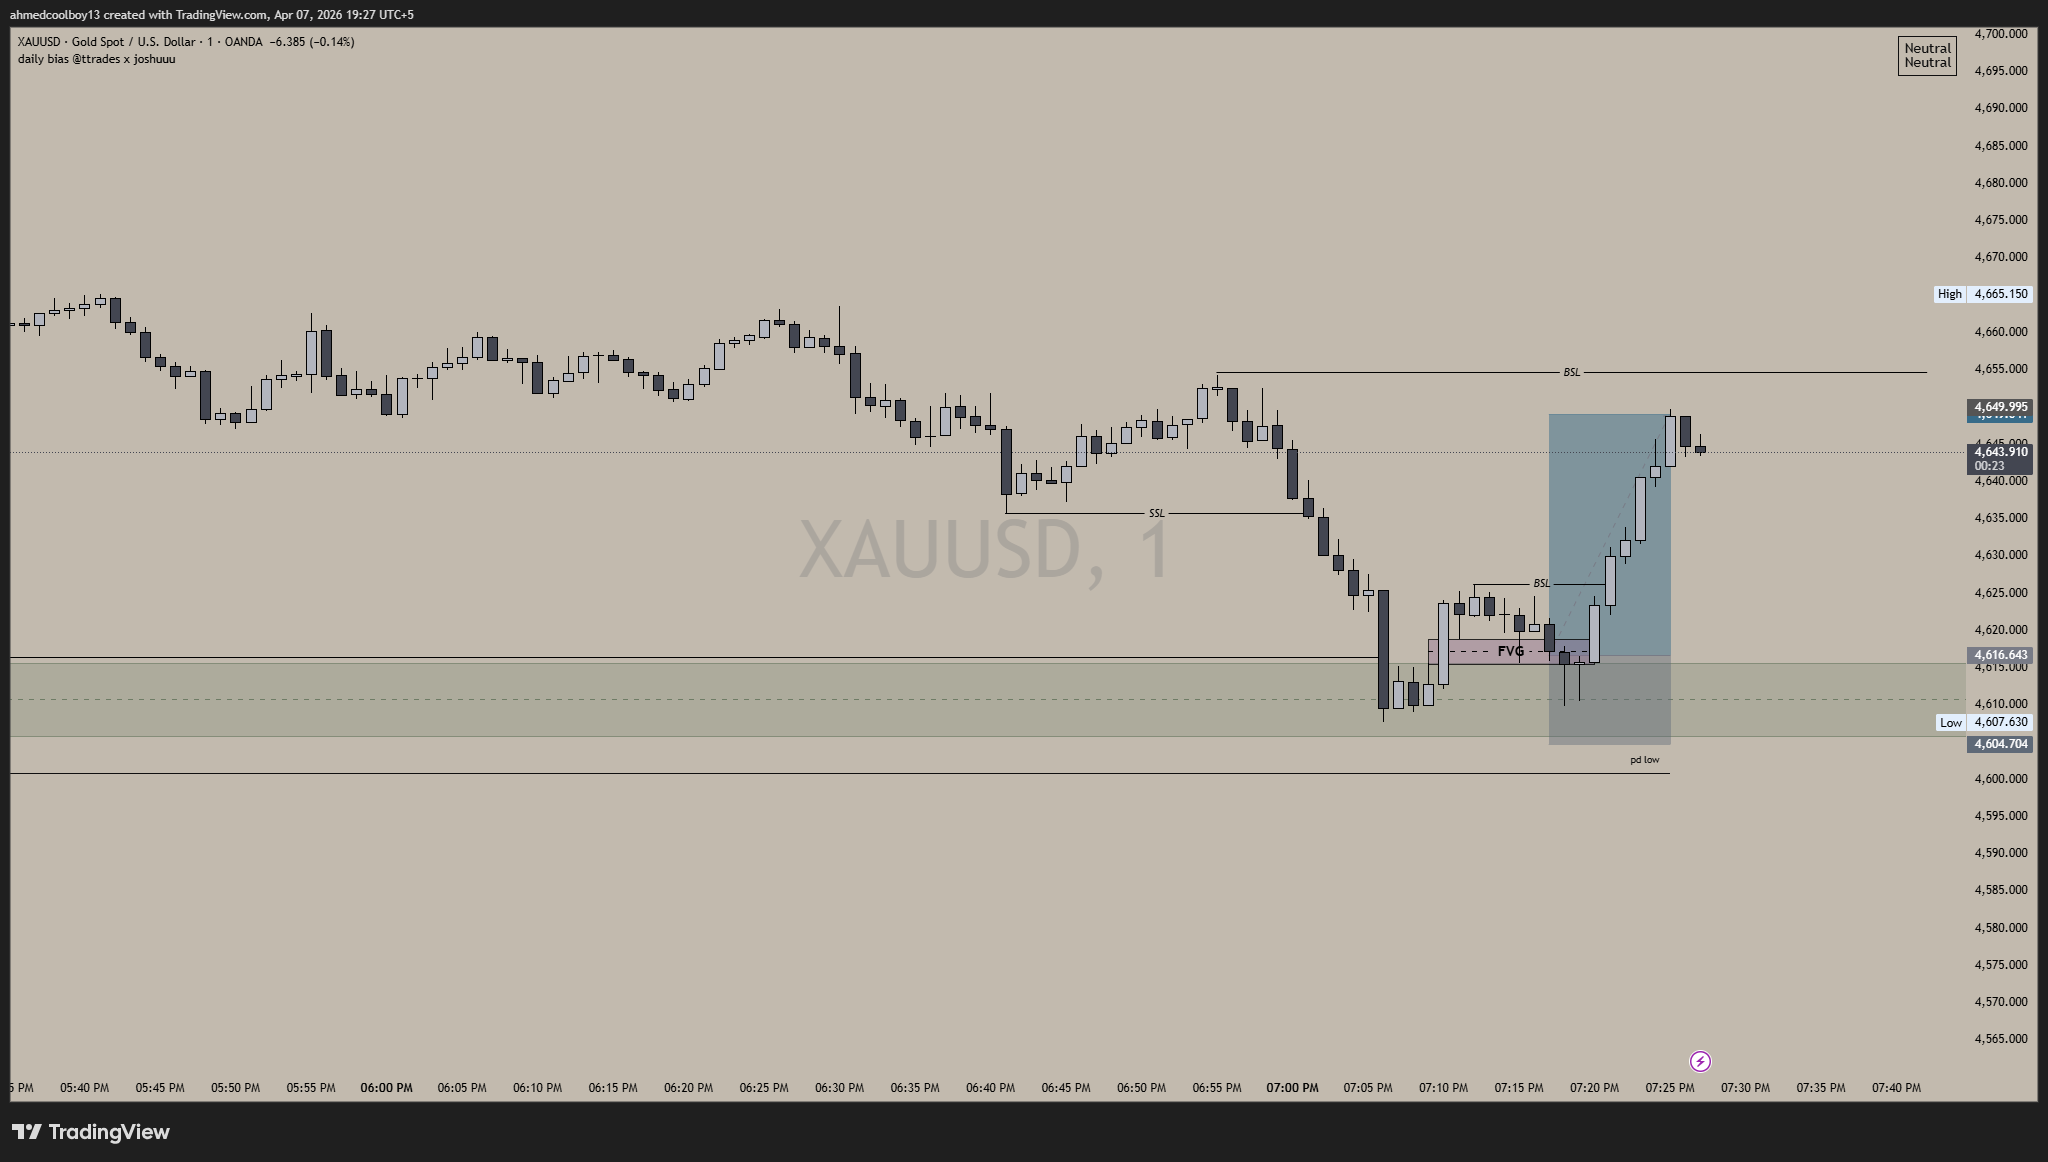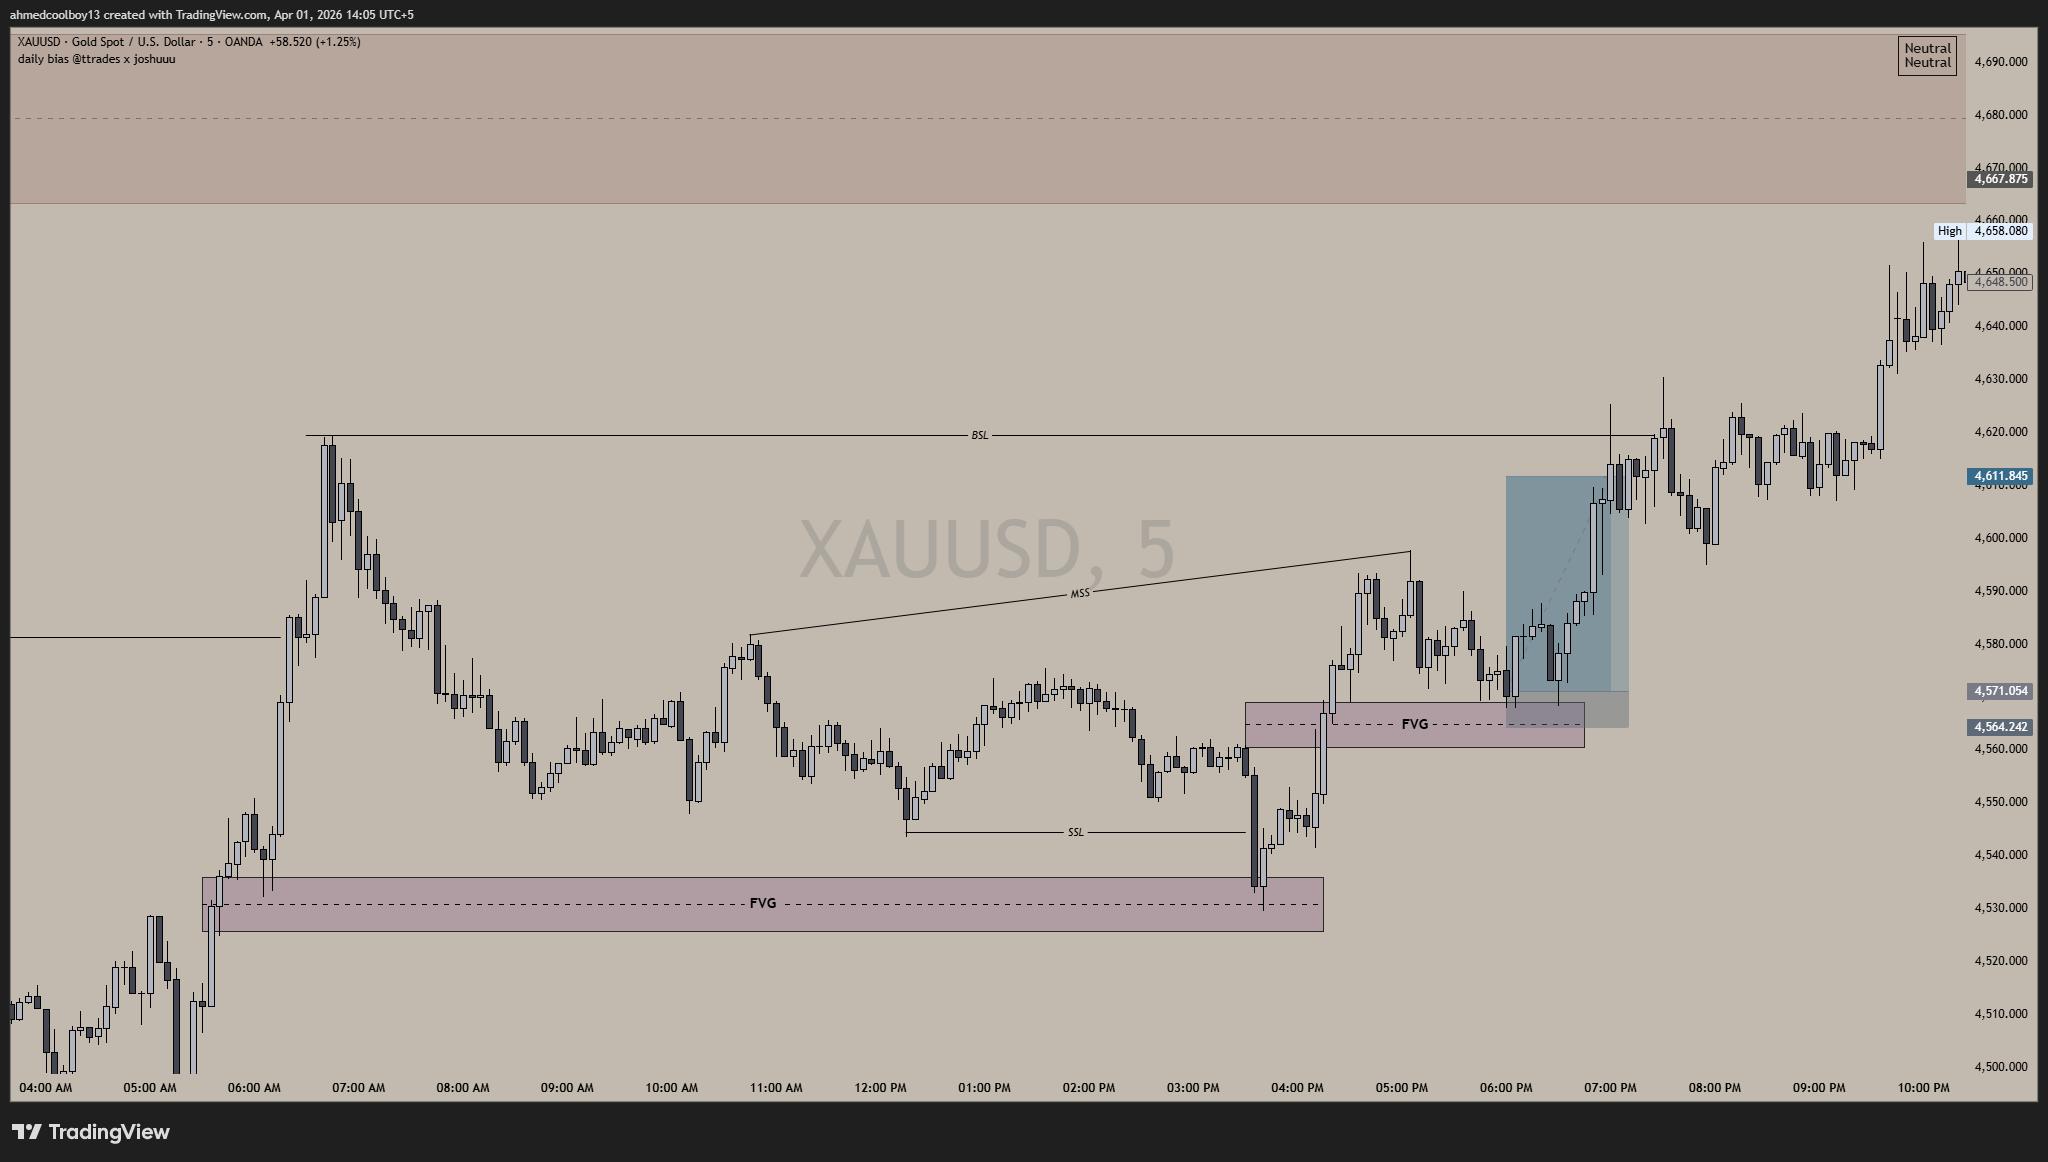
Our Strategy
Our strategy is built around understanding how the market truly moves. We focus on liquidity, market structure, and smart money concepts to identify high-probability trading opportunities with precision and confidence.
Understanding Smart Money
Instead of relying on indicators, we analyze how institutions move the market. By tracking liquidity and identifying key levels, we align our trades with the real flow of the market rather than guessing random entries.
Liquidity;
We identify areas where liquidity is resting and use them to anticipate market moves.
Market Structure;
Understanding highs, lows, and trend shifts helps us stay aligned with the market direction.
Entry Precision;
We wait for confirmations before entering trades to reduce risk and improve accuracy.
Risk Management;
Every trade is planned with proper risk-to-reward to protect capital and maximize returns
Strategy Breakdown
Daily Bias
Our daily bias is determined through a top-down analysis, starting from higher timeframes and refining down to lower timeframes for precision. This process allows us to understand the true direction of the market before looking for any trades. We begin by analyzing the higher timeframe, such as the Daily chart, to observe the most recent 1–2 candles and understand current market behavior. This helps us form an initial expectation of what the market may do next — whether it is likely to continue in the same direction or reverse. Next, we move to the 4-hour and 1-hour timeframes to identify key liquidity areas. We look at which liquidity has already been taken and which liquidity is still resting in the market. This gives us a clear idea of where the market is likely to move next, as price is often drawn towards uncollected liquidity. At the same time, we analyze the overall trend and market structure. By combining liquidity with trend direction, we filter out low-probability setups and align ourselves with high-probability moves. This ensures we are trading with the market, not against it. Finally, we refine our bias by identifying key zones such as order blocks on the 1-hour timeframe. These zones help us prepare for precise entries once confirmation appears. This structured approach allows us to build a clear, logical bias before executing any trade.
Daily Candles → Liquidity Analysis (4H/1H) → Trend Confirmation → Key Zones (Order Blocks)
Liquidity – What It Is and How It Works
Liquidity is the fuel of the market. It represents the areas where a large number of orders are placed, including stop losses, pending orders, and breakout entries. Institutions (smart money) need liquidity to enter and exit large positions, which is why price is often drawn towards these zones. In simple terms, liquidity exists where most traders place their orders — and the market moves to those areas to collect them.
Liquidity at Highs and Lows;
Liquidity is commonly found at swing highs and swing lows.
At swing highs:
Many traders place buy stop orders (breakout entries) and stop losses of sell trades above these highs. This creates a pool of liquidity above the highs.
At swing lows:
Traders place sell stop orders and stop losses of buy trades below these lows, creating liquidity below the lows.
Because of this, the market often moves above highs or below lows not to continue immediately, but to collect this liquidity before making the real move.
Liquidity Sweep;
A liquidity sweep occurs when the market moves beyond a previous high or low to trigger stop losses and breakout orders, then continues moving in that direction. This type of move usually indicates continuation, as the market clears liquidity and keeps pushing further in the same direction. It shows strength and momentum in the current trend.
Liquidity Grab;
A liquidity grab is a sharp move beyond a key level where the market collects liquidity and then quickly reverses in the opposite direction.
This move is designed to trap traders — especially those entering breakouts. After taking their liquidity, the market shifts direction, creating high-probability opportunities for traders who understand this behavior.
Liquidity Sweep: takes liquidity and continues in the same direction
Liquidity Grab: takes liquidity and reverses direction
Market Structure Shift (MSS)
Market Structure Shift (MSS) is one of the most important confirmations in our strategy. It represents a change in control between buyers and sellers, indicating that the market is no longer continuing in its previous direction and may be preparing for a new move.
Before an MSS occurs, the market is usually following a clear structure — forming higher highs and higher lows in an uptrend, or lower highs and lower lows in a downtrend. This structure shows which side is in control. However, this control is not permanent.
How MSS Forms;
An MSS typically occurs after liquidity has been taken from the market. For example, price may move above a previous high (taking buy-side liquidity) or below a previous low (taking sell-side liquidity). After this liquidity event, the market often changes behavior.
The shift happens when price breaks a key structure level in the opposite direction of the previous trend. This break is not just a random move — it signals that the previous trend is weakening and control is shifting to the opposite side.
How We Use MSS in Our Strategy;
After identifying liquidity and observing a sweep or grab, we wait for a clear MSS. Once the structure is broken, we look for pullbacks into key zones such as order blocks or imbalance areas to enter trades with precision. This allows us to enter at better prices with controlled risk and higher reward potential.
Entry Model (Precision Execution)
Our entry model is designed to provide high-probability and precise trade entries by combining liquidity, market structure, and price imbalance concepts. Instead of entering randomly, we wait for a complete sequence of confirmations that align with our strategy. This ensures that every trade is taken with logic, discipline, and calculated risk.
Step 1: Price Taps into Order Block (OB)
The process begins when price returns to a key Order Block (OB), which represents an institutional zone where strong buying or selling previously occurred. These zones act as potential areas of reaction, where price is likely to respond again. However, we do not enter immediately on the first touch — we observe how price behaves within this zone.
Step 2: Liquidity Sweep or Grab
Once price enters the Order Block, it often performs a liquidity sweep or grab. This means the market takes out nearby highs or lows within or around the zone to collect stop losses and trap traders. This step is crucial because it clears liquidity and prepares the market for the actual move.
Step 3: Market Structure Shift (MSS)
After liquidity is taken, we wait for a clear Market Structure Shift. This confirms that control has changed — from buyers to sellers or vice versa. MSS is the confirmation that the market is ready to move in the intended direction. Without this step, the setup is incomplete and risky.
Step 4: Formation of Fair Value Gap (FVG)
Following the MSS, the market often creates an imbalance known as a Fair Value Gap (FVG). This represents an area where price moved aggressively, leaving behind inefficiency. These gaps act as magnets for price, as the market tends to revisit them before continuing its move.
Step 5: Tap and Rejection in FVG (Entry Point)
The final step is waiting for price to return to the FVG. When price taps into this zone and shows rejection (such as strong reaction, wicks, or momentum shift), it provides the ideal entry point. This allows us to enter with precision, tight stop loss, and high risk-to-reward potential.
Order Block → Liquidity Sweep/Grab → MSS → FVG Formation → FVG Tap + Rejection = Entry
Complete Entry Flow (Top-Down Execution Model)
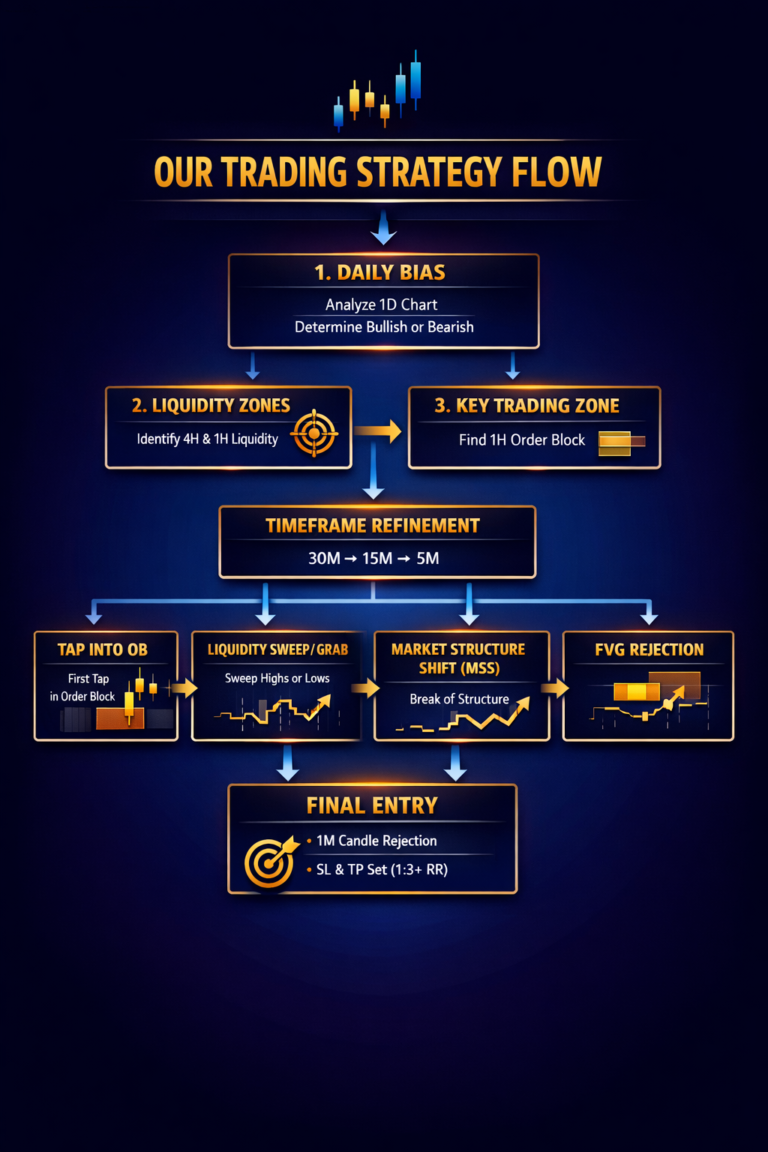
Our trading process follows a structured top-down approach, starting from higher timeframes and refining down to lower timeframes for precise execution. This ensures every trade is taken with clarity, patience, and confirmation rather than emotion or guessing.
Step 1: Higher Timeframe Analysis (Daily Bias)
We begin with the Daily timeframe to determine the overall market direction. Here we analyze the last 1–2 candles to understand current market behavior and form a directional bias. This helps us decide whether we should be looking for buy opportunities or sell opportunities.
Step 2: 4H Liquidity Analysis
After establishing bias, we move to the 4-hour timeframe to identify key liquidity areas. We look for equal highs, equal lows, and untouched liquidity zones where price is likely to move. This gives us an idea of where the market is targeting next.
Step 3: 1H Liquidity + Structure Confirmation
On the 1-hour timeframe, we refine our analysis by identifying precise liquidity levels and market structure. We combine liquidity with trend direction to find a potential high-probability trading zone. This becomes our area of interest for further refinement.
Step 4: Zone Identification
From the 1H analysis, we mark a key trading zone (such as an Order Block or high reaction area). This zone represents where institutional activity has previously occurred and where price is likely to react again.
Step 5: Timeframe Refinement (30M → 15M)
We then refine this zone by moving down to 30-minute and then 15-minute timeframes. This helps us narrow down the exact area where price is likely to react, reducing risk and improving precision.
Step 6: Move to 5M for Execution Preparation
On the 5-minute timeframe, we closely monitor price action within the refined zone. We wait for price to approach and interact with the level while maintaining patience for full confirmation.
Step 7: Entry Model Activation
At this stage, we apply our entry model sequence:
1. First tap into Order Block
2. Liquidity sweep or grab occurs
3. Market Structure Shift (MSS) confirmation
4. Fair Value Gap (FVG) formation
5. Price returns into FVG
Step 8: Final Entry Confirmation (1M Execution)
On the 1-minute timeframe, we wait for a clear rejection from the FVG zone. Once a strong rejection candle appears, confirming that liquidity has been taken and momentum has shifted, we execute our trade.
Stop Loss Placement;
Stop loss is placed below (or above) the liquidity sweep area to protect against invalidation. This ensures we are protected from market manipulation and false moves.
Take Profit Strategy;
Take profit is targeted at the opposite liquidity pool (BSL/SSL). We aim for a minimum risk-to-reward ratio of 1:3, although in strong setups trades can extend up to 1:5 or even 1:10 depending on market conditions.
Daily Bias → 4H Liquidity → 1H Structure + Liquidity → Zone Identification → 30M/15M Refinement → 5M Monitoring → OB Tap → Liquidity Sweep/Grab → MSS → FVG → 2nd Tap → 1M Rejection → Entry
Screenshots Of The Trades On This Strategy